Below is a lecture on Heart valve disease taken at UCSF. I really like this lecture because it mentions all of the heart pathologies that come into play when the valves are not working properly. There are some funny moments, and the instructor--Jonathan Zaroff M.D.-- that gives the lecture made me lol. He's serious, and he knows his stuff but at the same time, he adds a little humor during the lecture. You won't get bored, i guarantee.
Sunday, October 3, 2010
Saturday, October 2, 2010
SPI Certificate: Good or Bad? Guarantee or Uncertain?
So a month ago, i got a letter in the mail and this is what i got:

I feel happy that i passed but at the same time, i wonder, will this certificate guarantee me a job? Uh..not really. I may sound less optimistic here but i'm just being a realist. I realize that experience matters most in life rather than a piece of paper or diploma/certificate that tells you "you're the man" for the job. A person can know all the principals components of Ultrasound Technology but can that person really scan? The point i'm trying to make is, i hope i'm not that type of person---knows a lot, but can't do a lot. I rather be booksmart and "scan-smart" at the same time, which is why i want to scan as much as possible so i can get a job eventually.
But then you got the "haters" or the "jealous ones" that get threatened when you try to become the "master" of scanning. And what do these poeple do? They slow you down, and man...they have been distracting me since day one. Dood...relax! I'm just trying to get my career started and its not like i'm saying "i'm better than you" (although i am because i know more than you do--sorry for being cocky), its more like me trying to become successful. Dah well...what can you do right? Keep moving forward and never look back...that's my motto for this fall!
And then now, i got to take my license ECHO exam so i can be ellegible to work as an ECHO sonographer. But truth is, a lot of places are looking for experience. SMH. I got a feeling that i'll be jobless within the next two years so what i'm i going to be doing during that time? Only time will tell i guess. But one thing i'm certain with is my scanning abilities. So if any employers are reading this, you better consider picking me because i'm the type of tech that gets the job done completely. And i know a lot of experienced techs out there but they don't know WTF their doing or looking at! And that's my word!
But enough of the hostility...i know passing the SPI is a doorway opportunity to become ARDMS elligible and since i have a B.S. degree in a particular discipline, i have the upper hand. I feel content where i am now but at the same time, i'm concerned about me getting a job in the future.
ECHO Basics 101: Structures Viewed
LEFT PARASTERNAL LONG-AXIS VIEW
- Anterior right ventricular free wall
- Right ventricular cavity
- Interventricular Septum, including membranous portion
- Left ventricular cavity
- Left ventricular posterior wall
- Mitral valve and apparatus (chordae tendinae)
- Left Atrium
- Aortic valve (right and non-coronary cusps--left cusp often not visible)
- Aortic root (anterior and posterior wall)
- LVOT
- Cornoary Sinus (found on AV groove, next to Posterior MVL)
- Descending thoracic aorta
- Pericardium
- Wall Segments: Basal, Mid, and Apical
RIGHT VENTRICULAR INFLOW VIEW
- Obtained by starting in PLAX and angling anteriorly
- Right Atrium
- Right ventricle
- Tricuspid valve (Anterior and Posterior leaflets)
- Eustachian valve often seen (from IVC)
RIGHT VENTRICULAR OUTFLOW VIEW
- Obtained by starting in PLAX and angling posteriorly
- Right ventricle
- Pulmonic valve
- Main pulmonic artery
PARASTERNAL SHORT-AXIS VIEW
- Left ventricle - all wall segments: Anterior LVFW, Anterior-Lateral LVFW, Posterior-Lateral LVFW, Inferior-Posterior LVFW, Inferior LVFW, and Ventricular Septum
- Interventricular Septum - all wall segments: Anterior VS, Middle VS, Inferior VS
- Right ventricle - all wall segments: Anterior RVFW, Middle RVFW, Inferior RVFW
- Aortic valve - all three cusps: Right coronory cusp, Left coronary cusp, and non-coronary cusp
- Pulmonic valve
- Tricuspid valve (Anterior and Septal leaflets)
- Mitral valve (Anterior and posterior leaflets)
- Papillary muscles (Anterior-Lateral and Posterior-medial)
- Right atrium
- Left atrium
- Interatrial septum
- Left Atrial Appendage
- Pericardium
APICAL FOUR-CHAMBER VIEW
- Left ventricle (septal wall, apex, and lateral wall)
- Right ventricle (free wall)
- Right atrium (Chiari network)
- Left atrium (Coronary sinus - obtained by posterior angulation)
- Mitral valve (Anterior and Posterior leaftlets)
- Tricuspid valve (Anterior and Septal leaflets)
- Interatrial and interventricular septae
- Pulmonary veins
APICAL FIVE-CHAMBER VIEW
- Left ventricle
- Left atrium
- Atrioventricular valves
- Right ventricle
- Right atrium
- Aortic valve
- LVOT
- Ascending aorta
APICAL TWO-CHAMBER VIEW
- Left ventricle (Anterior wall, Inferior wall, and apex)
- Left atrium
- Left Atrial Appendage
- Coronary sinus
- Mitral valve (Anterior and Posterior leaflets)
APICAL LONG-AXIS VIEW
- Left ventricle (septum, posterior wall, apex)
- Left atrium
- Aortic valve
- Ascending aorta
- Mitral valve and apparatus
- Right ventricle (small portion)
SUBCOSTAL FOUR-CHAMBER VIEW
- Left ventricle (septal wall, lateral wall)
- Right ventricle (free wall)
- Left atrium
- Right atrium
- Atrioventricular valves
- Interatrial septum
- Interventricular septum
- 5-Chamber view can be obtained by angling the probe upward
- Useful for confirming septal defects with Doppler
SUBCOSTAL SHORT-AXIS VIEW
- Left ventricle - short axis
- Right ventricle
- Tricuspid valve
- Pulmonic valve
- Right ventricular outflow tract
- Main pulmonary artery
SUBCOSTAL INFERIOR VENA CAVA VIEW
- Inferior vena cava
- Hepatic veins
- Right atrium
- Caudate of liver
- Ligamentum venosum
- Eustachian valve
- Chiari Network
- Useful for collapsing IVC when patient sniffs
SUPRASTERNAL VIEW/NOTCH
- Ascending aorta
- Aortic arch
- Descending aorta
- Brachiocephalic or innominate artery
- Left common carotid artery
- Left subclavian artery
- Right pulmonary artery
- useful in detecting Aortic coarctation
ECHO Basics 101: Heart Anatomy
The heart is a cone-shaped, hollow, fibromuscular organ located in the middle mediastinum between the lungs and pleurae. The organ is surrounded by pericardium (which appears echogenic in US) that is made up of fibrous tissue and serosal components. Its purpose is to reduce friction with each cardiac movement; allow freedom of movement of the heart; contains the heart within the mediastinum; and acts as a barrier to infection (i.e. endocarditis). The weight of the heart varies in males (280-340g) and in females (230-280g), and can be calculated by multiplying 0.45% and 0.40% of total body weight in males and females, respectively.
The heart is divided into four chambers: right atrium, left atrium, right ventricle, and left ventricle. The two most important valves are the semilunar (AoV, PV), and atrioventricular (MV, TV). The left side of the heart is usually thicker and contains a great deal of pressure than the right side. However, volume pumped by both sides is equal to ensure normal circulation of flow. The right side supplies the pulmonary circulation with a lower oxygen saturation of about 75%, and receives blood from SVC and IVC that enters to the right atrium. The right side of the heart contains the TV which closes during right ventricular systole and contained blood in right ventricle is propelled out of RVOT through the semilunar PV to the lungs or pulmonary circuit. In contrast, the left side of the heart has a systolic pressure of about 120 mmHg with a high oxygen saturation of 95-100%, and receives blood from the lungs through the pulmonary veins that enters in the back of the left atrium. The left side of the heart contains the MV which opens during left atrial systole and closes during ventricular systole, in which blood is propelled out of the LV through the outflow tract and into the AO.
In ECHO, or Transthoracic Exam, a number of specific protocols are induced and the structures can be viewed from various positions and windows. The shots obtained are the following:
1. Left Parasternal Long-Axis View (PLAX or PSLA)
2. Left Parasternal Right Ventricular Inflow View (RVIT)
3. Left Parasternal Right Ventricular Outflow View (RVOT)
4. Parasternal Short-Axis View (SAX or PSSA)
5. Apical Four-Chamber View (A4C)
6. Apical Five-Chamber View (A5C)
7. Apical Two-Chamber View (A2C)
8. Apical Long-Axis View or Apical Three-Chamber View (A3C)
9. Subcostal Four-Chamber View
10. Subcostal Short-Axis View
11. Subsubcostal Inferior Vena Cava View
12. Suprasternal View/Notch
ECHO Exam
its that time again....starting on Oct through end Dec, i will be studying for my ECHO license exam so i can obtain my certificate as a licensed ECHO sonographer. Am i excited? Well, i'm kind of nervous but happy at the same time, but all i'm thinking about is starting my career as an Ultrasound ECHO Technologist. I have applied to several clinics / hospitals and i'm telling you...it "really" drains the shit out of you! There are times when i get frustrated because all these places are looking for 1-3 years experience. WTF?!? Just hire me already, i'm ready and i won't let you down! Oh well, i guess that's just how it is and all i got to do now is keep fighting and looking.
Hopefully, when i pass my ECHO exam, i'll be ready to scan the patients and i'll know what to expect with the procedures. So wish me luck...whoever is reading this.
Hopefully, when i pass my ECHO exam, i'll be ready to scan the patients and i'll know what to expect with the procedures. So wish me luck...whoever is reading this.
Friday, August 6, 2010
RESULT: PASS
I just took my SPI today, and the end result was a good one. Although there's more to come, this is just the beginning of a long journey! But to celebrate, i decided to play Drake's video "Over"...because i'm glad that physics is really OVER!!
Monday, August 2, 2010
Sunday, August 1, 2010
I'M BACK!!!
i know its been awhile, but i have been incredibly busy studying for my physics exam (which will be on Aug. 6th)...not to mention, trying to look for a job as well. The Job market is tough out there! Anyways, i'm back on the game and i'll be updating my blog site frequently. I guarantee!!
Monday, January 25, 2010
Doppler Shift: High vs. Low
The Doppler shift is a change in frequency and wavelength caused by the motion of objects. This Doppler effect is provided by the Doppler equation that deals with three situations: sound source, moving reciever, or moving reflector.
Doppler shift is equal to the recieved frequency (i.e. reflector) minus the source frequency (i.e. transducer/sound source). A difference is required between these two frequencies in order for doppler shift to occur. If the recieved frequency is greater than the transmitted, then a positive or high doppler shift occurs. In a high doppler shift, the reflected echo is going towards the sound source (sound and blood moving in opposite direction)thus an "upstream" condition is seen. If, however, the transmitted frequency is greater than the recieved, then a negative or low doppler shift occurs. In a low doppler shift, the reflected echo is seen going away from the transducer (sound and blood moving in same direction) thus a "downstream" condition is seen. Therefore, the recieved and transmitted frequencies must not be equal in order for positive or negative doppler shift to occur. An example of no doppler shift can be seen in a vessel that is completely occluded, in which the recieved and transmitted frequencies are equal thus no flow occurs.
Doppler shift is also equal to the velocity, cosine angle, and operator frequency. If the angle indicator is increased, then cosine angle decreases and depending upon the angle, doppler shift is decreased by half or one. If the angle is at 0, then cosine angle increases by 1, thus doppler shift is increased. The angle to avoid is 90 degree or right angle, which sets the cosine angle at 0 thereby causing no doppler shift. That is why we steer the box to avoid the 90 degree angle especially when taking waveforms during vascular studies. During the vascular studies, a 45-60 degree angle is required for doppler shift to occur. An angle of 60 will yield a cosine angle of 0.5 thereby causing the doppler shift to increase by half.
In relation to the operator frequency, if for example, a 2.5Mhz transducer is switched to 5Mhz, then a high doppler shift occurs (and vice-versa). If the velocity of blood is increased (as seen in stenosis), then a high doppler shift occurs as well (and vice-versa). Therefore, in high doppler shift, the velocity of blood is usually fast and will exhibit a bright color, whereas in low doppler shift the velocity of blood is slow and will exhibit a dark color.
Stenosis
Stenosis is defined as the narrowing of the lumen due to a thrombus or clot in a vessel. The narrowing can occur in the aorta, pulmonary, pyloric, or spinal. Stenosis can be divided into three regions: proximal stenosis, at/mid stenosis, and distal stenosis.
In proximal stenosis, laminar flow is seen associated with high pressure and low speed thus exhibiting a dark color when using color doppler. As the blood approaches at the stenosis site, flow speed increases and pressure drops (i.e. Bernoulli Effect), and the flow changes from laminar to disturbed flow, which can be described as a "forward curved flow". When color doppler is applied, the color will appear bright d/t the high speed at the stenosis site thus exhibiting a high or positive doppler shift. As the flow speed increases at the region of stenosis, turbulent flow will eventually occur. Turbulent flow can be seen distal to the stenosis site, and is describe as choatic or blood circular flow (i.e. eddie's). In distal stenosis, pressure is mediated as well as flow speed and when color doppler is applied, the image will display mixed colors. The onset of turbulence flow can be predicted by Reynold's number as it induces a critical rate of 2000. The sounds produced by turbulence can be auscultated and described as bruits, which is an abnormal blowing or swishing sound caused by atherosclerosis. If palpated by hand, the sound is described as "thrill".
A person who is diagnosed with stenosis will show no symptoms or is asymptomatic due to the "continuity rule", which states that blood is neither created nor destroyed as it flows through the vessel. The flow is close to normal due to the volumetric flow rate that is held constant at 100 cm/s throughout the vessel. The volumetric flow rate (or Poiseuille's Law) is determined by adding up the velocities from the three regions (proximal, at, and distal to the stenosis) to give the average flow speed. The average flow speed multiplied by the cross sectional area of the vessel is equal to the volumetric flow rate. In other words, during stenosis, the volumetric flow rate is converted to the average flow speed, which is related to Doppler Shift. Therefore, doppler shift is directly related to flow speed, not volumetric flow rate. The volumetric flow rate is only used for long straight vessels without stenosis and the diameter in Poiseuille's law depends on the diameter to the fourth power (entire vessel). By contrast, the continuity rule applies to vessels with stenosis and the flow speed depends on the diameter to the second power (short portion of a vessel).
If, however, the clot enlarges and causes the vessel to become occluded (thus no doppler shift and no flow), then the pt will exhibit symptoms and the condition should be treated to prevent future AAA, CVA, or TIA.
read info on stroke/CVA
read info on carotid artery stenosis
Wednesday, January 20, 2010
Flow
Fluids are substances that flow or "move" and take the shape of a container. Gases and liquids are fluids that can flow, and these materials can be characterized by density and viscosity. The units for density and viscosity are in poise or kg/m-s. Density is mass over volume, and the mass is a measure of the resistance of an object to acceleration. This resistance is known as "inertia". An example of inertia is the resistance of blood to the vessel wall, which can be seen in a laminar-type flow. Viscosity, on the other hand, is the resistance to flow offered by a fluid in "motion". So if there is more resistance or pressure, than fluid motion is altered thus flow speed is changed. A perfect example can be seen in blood. Blood has a higher viscosity than water, that is, blood is much "thicker" and 55 times that of water. In a pt diagnosed with polycythemia, for example, the blood viscosity will be about 0.10 poise d/t the increasing amount of RBC's in that person's blood system. If, however, the pt is diagnosed with anemia, then blood viscosity will decrease to about 0.02 poise.
In order for flow to occur, a pressure difference is required. If the pressure from Point A is equal to Point B, then no flow will occur. So a pressure difference must be required for flow to occur because generally fluids move from high-pressure to low-pressure. This can also be seen in the Bernoulli Effect, which is the drop off in pressure and increase in flow speed at stenosis (narrowing of lumen). The pressure difference can be generated by the heart, which can "pump" or increase the volumetric flow rate. The volumetric flow rate can be described as Q, which is proportional to the pressure difference (force/area) and inversely proportional to resistance (poise). Therefore, as pressure difference increases, then Q increases; and as flow resistance increases, then Q decreases.
Flow resistance in a long, straight tube depends on the fluid viscosity, tube length, and radius of the vessel. That is, if tube length and viscosity increases, then flow resistance increase thus Q decrease. If, however, radius increase, then flow resistance decrease thereby increasing Q. Using Poiseuille's equation to determine Q can be applied but only for steady flow in long straight tubes without stenosis. Therefore, the equation serves only to provide a rough approximation of the conditions in blood circulation. If, however, stenosis is present, then the equation is converted to the "average flow speed", which is used to determine the average velocity in a vessel with stenosis.
There are five different types of flow: Plug, Laminar, Parabolic, Disturbed, and Turbulence. In plug flow, blood moves in "one" unit thus having no difference in flow speed. They can be seen in the branches of vessels (i.e. RA's of mid ABD AO), and as the blood goes down the tube, the flow becomes laminar.
Laminar flow consists of layers with differences in flow speeds, with the center having the highest speed, and the layer closest to the vessel wall having the lowest (d/t inertia)speed. As a result, when using doppler, laminar flow will exhibit only one color (either red or blue, depending upon color map) with the center appearing bright. Laminar flow is the most common flow in our circulatory system, and is described as good flow without stenosis. They are broken down by two types: Parabolic and Disturbed.
Parabolic flow is a form of laminar flow, but with the addition of more layers and organized speed. However, parabolic flow occurs only in "long straight tubes" therefore the flow is not dominant within our blood system. A "laminar nonparabolic flow" is most commonly seen in blood circulation because the vessels generally are not long and straight. The other form of laminar flow is disturbed flow, which is described as a forward "curved" flow that occurs in the region of stenoses or at a bifurcation (i.e. DST ABD AO). In disturbed flow, particles of fluid still flow in the forward direction.
In the final category, turbulent flow or turbulence can be described as random or choatic (i.e. entropy). The reason for this is the presence of blood circles also known as "eddie's", which move at different speeds. The onset of turbulent flow can be predicted by using Reynold's number, which is proportional to flow speed, diameter, and density. That is, as flow speed, diameter, and density increases, then Reynold's number increases; And if the number increases at a critical rate (at about 2000), then suspect turbulent flow and presence of a clot. Turbulent flow can be seen during post-stenosis, whereas at stenosis, disturbed flow is seen. When using doppler, turbulent flow will exhibit mixed colors.
Tuesday, January 12, 2010
Physics of Ultrasound: Pulse Echo US - Segment 4
excellent video explaining about tissue harmonics, signal processing, and ultrasound modes...expect more of these videos..
Ultrasound Modes: A, B, & M
A mode is an operational state that a system has been switched to. A normal mode occurs when all parts of a system oscillate with the same frequency. For ultrasound imaging, different modes are used to examine the arterial/venous system, heart, pancreas, urinary system, ovaries, spinal cord, joints, and more. The different types of modes can be controlled by the operator or tech.
 A-Mode, or Amplitude Modulation, is the display of amplitude spikes of different heights. It is used for opthamalolgy studes to detect finding in the optic nerve. A-Mode consists of a x and y axis, where x represents the depth and y represents the Amplitude. The above image shows an example of A-Mode display.
B-Mode, or Brightness Modulation, is the display of 2D map of B-Mode data, and is the most common form of ultrasound imaging. Unlike A-Mode, B-Mode is based on brightness with the absence of vertical spikes. Therefore, the brightness depends upon the amplitude or intensity of the echo. There is no y axis on B-Mode, instead, there is a z axis, which represents the echo intensity or amplitude, and a x axis, which represents depth. B-Mode will display an image of large and small dots, which represent strong and weak echoes, respectively. Below is an example of B-Mode imaging of an echogenic mass in a particular organ.
get more information on US modes via us-tip after the jump.
 A-Mode, or Amplitude Modulation, is the display of amplitude spikes of different heights. It is used for opthamalolgy studes to detect finding in the optic nerve. A-Mode consists of a x and y axis, where x represents the depth and y represents the Amplitude. The above image shows an example of A-Mode display.
B-Mode, or Brightness Modulation, is the display of 2D map of B-Mode data, and is the most common form of ultrasound imaging. Unlike A-Mode, B-Mode is based on brightness with the absence of vertical spikes. Therefore, the brightness depends upon the amplitude or intensity of the echo. There is no y axis on B-Mode, instead, there is a z axis, which represents the echo intensity or amplitude, and a x axis, which represents depth. B-Mode will display an image of large and small dots, which represent strong and weak echoes, respectively. Below is an example of B-Mode imaging of an echogenic mass in a particular organ.

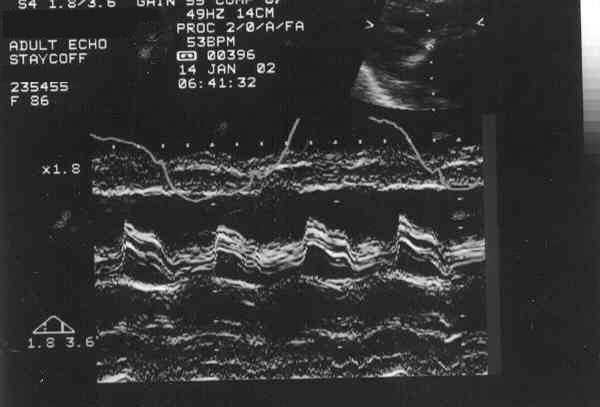
M-Mode, or Motion Mode (also called Time Motion or TM-Mode), is the display of a one-dimensional image that is used for analyzing moving body parts commonly in cardiac and fetal cardiac imaging. This can be accomplished by recording the amplitude and rate of motion in real time by repeatedly measuring the distance of the object from the single transducer at a given moment. The single sound beam is transmitted and the reflected echoes are displayed as dots of varying intensities thus creating lines across the screen. Below is an TM-Mode one dimensional imaging in a pt with moderate mitral stenosis (calcific) that shows evidence of multiple echoes of the anterior mitral leaflet.
get more information on US modes via us-tip after the jump.
Monday, January 11, 2010
Ultrasound Physics & Terminology
This module includes the following:
• Basic physics terms
• Basic principles of ultrasound
• Ultrasound terminology and terms
• Common artifacts seen
• Doppler principles
• Terms for labeling and scan orientation
BASIC PHYSIC TERMS
- Ultrasound: Utilizes sound waves of very high frequency (2MHz or
greater). It is propagated via waves of compression and
rarefaction, and requires a medium (tissue) for travel.
The higher the frequency, the less depth penetration,
however the resolution is improved.
- Resolution: Is the parameter of an ultrasound imaging system that
characterizes its ability to detect closely spaced
interfaces and displays the echoes from those interfaces
as distinct and separate objects. The better the
resolution, the greater the clarity of an ultrasound
image.
- Axial Resolution: Is the minimum required reflector separation along the
direction of propagation required to produce separate
reflections. Good axial resolution is achieved with short
spatial pulse lengths. Short spatial pulse lengths are a
result of higher frequency and higher damped
transducers. Therefore the higher the frequency the
better the resolution.
- Lateral Resolution: Is the minimum reflector separation perpendicular to
the direction of propagation required to produce
separate reflections. Good lateral resolution is achieved
with narrow acoustic beams. A narrow acoustic beam is
the result of a long near zone and a small angle of
divergence in the far zone.
- Transducers: Convert one form of energy to another. Ultrasound
transducers convert electric energy into ultrasound
energy and vice versa. Transducers operate on
piezoelectricity meaning that some Materials (ceramics,
quartz) produce a voltage when deformed by an applied
pressure, and reversely results in a production of
pressure when these materials are deformed by an
applied voltage.
- Pulsed Transducers: Consists of one transducer element which functions as
both the source and receiving transducers.
- Mechanical Probes: Allows the sweeping of the ultrasound beam through
the tissues rapidly and repeatedly. This is accomplished
by oscillating a transducer. The oscillating component is
immersed in a coupling liquid within the transducer
assembly. In our case the coupling fluid is deionized
water. It is important that the fluid is bubble free, so
that your image is not compromised. Check the
water level in the transducer assembly before
scanning and if you see air bubbles, make sure
you fill it with the deionized water.
- Attenuation: A decrease in amplitude and intensity, as sound travels
through a medium. Attenuation occurs with absorption
(conversion of sound to heat), reflection (portion of
sound returned from the boundary of a medium, and
scattering (diffusion or redirection of sound in several
directions when encountering a particle suspension or a
rough surface). These different forms of attenuation are
responsible for artifacts that may be in your
image. Some of these artifacts are useful and some are
not. Some artifacts are produced by improper
transducer location or machine settings.
BASIC PRINCIPLES OF ULTRASOUND
Sound Waves
Audible sound waves lie within the range of 20 to 20,000 Hz. Clinical
ultrasound systems use transducers of between 2 and 17 MHz. The
Vevo VisualSonics ultrasound system uses frequencies of between 20
to 55 MHz. Sound waves do not exist in a vacuum, and propagation in gases is
poor because the molecules are too widely spaced which is why lung
does not image well with ultrasound.
A gel couplant is used between the skin of the subject and the
transducer face otherwise the sound would not be transmitted across
the air-filled gap.
The strength of the returning echo is directly related to the angle at
which the beam strikes the acoustic interface. The more nearly
perpendicular the beam is the stronger the returning echo; smooth
interfaces at right angles are known as specular reflectors. This is best
seen in the walls of a large blood vessel such as the aorta or the
carotid artery.
Transducers
The choice of which transducer should be used depends on the depth
of the structure being imaged. The higher the frequency of the e
transducer crystal, the less penetration it has but the better the
resolution. So if more penetration is required you need to use a lower
frequency transducer with the sacrifice of some resolution.
The shape of the beam is varied and is different for each transducer
frequency. There is a fixed focused region of the ultrasound beam
which is indicated on the system with a small triangle to the right of
the image. This indicates the focal zone of that transducer and is
where the best resolution can be achieved with that particular
transducer. Effort should be taken to position the object of interest in
the subject to within that focused area to obtain the best detail. This
can be achieved with the use of more or less ultrasound gel and
moving the transducer closer to or farther away from the subject.
ULTRASOUND TERMINOLOGY AND TERMS
- Anechoic: A structure that does not produce any internal echoes
- A-Mode/Amplitude modulation: A single dimension display consisting of a horizontal
baseline. This baseline represents time and or distance with upward (vertical) deflections (spikes depicting the acoustic interfaces)
- Attenuation: The ultrasound beam undergoes a progressive
weakening as it penetrates the body due to absorption, scattering and beam spread. The amount of weakening is dependent on frequency, tissue density, and the number and types of interfaces
- B-Mode/Brightness modulation: A two-dimensional display of ultrasound. The A-mode
spikes are electronically converted into dots and displayed at the correct depth from the transducer.
- Complex: Refers to a mass that has both fluid-filed and solid
areas within it
- Cystic: This term is used to describe any fluid-filled
structure, for example, the urinary bladder
- Acoustic Enhancement: Sound is not weakened (attenuated) as it passes
through a fluid-filled structure and therefore the
structure behind appears to have more echoes than
the same tissue beside it
- Frequency: The number of complete cycles per second (Hertz)
- Gain: Refers to the amount of amplification of the returning
echoes
- Gel Couplant: A trans-sonic material which eliminates the air
interface between the transducer and the animal’s
skin
- Homogenous: Of uniform appearance and texture
- Hypoechoic: A relative term used to describe an area that has
decreased brightness of its echoes relative to an
adjacent structure
- Hyperechoic: Also a relative term used to describe a structure
which has increased brightness of its echoes relative
to an adjacent structure
- Interface: Strong echoes that delineate the boundary of organs,
caused by the difference between the acoustic
impedance of the two adjacent structures; an
interface that is usually more pronounced when the
transducer is perpendicular to it
- M-Mode: is the motion mode displaying moving structures
along a single line in the ultrasound beam
- Noise: An artifact that is usually due to the gain control
being too high
- Reverberation: An artifact that results from a strong echo returning
from a large acoustic interface to the transducer. This echo returns to the tissues again, causing additional echoes parallel and equidistant to the first echo.
- Shadowing: Failure of the sound beam to pass through an object,
e.g. a bone does not allow any sound to pass through
it and there is only shadowing seen behind it
- Time-Gain Compensation: Compensation for attenuation is accomplished by
amplifying echoes in the near field slightly and
progressively increasing amplification as echoes
return from greater depths
- Transducer: A device which houses the element for transmitting
and receiving ultrasound waves. Also referred to as a
probe or Scanhead
- Velocity (of sound): Is the speed at which a sound wave is traveling. In
soft tissue at 37 degrees C. sound travels at 1540
m/second
COMMON ARTIFACTS SEEN
- Reverberation: Multiple reflections commonly seen in the bladder or
heart
- Shadowing: Created by strong reflectors, or attenuating
structures, i.e. bone, gas, calcifications and air
- Enhancement: Increase in reflection amplitude from reflectors that
lie behind a weakly attenuating structure, i.e. cysts,
solid masses
- Speckle: The granular appearance of images and spectral
displays that is caused by the interference of echoes
from the distribution of scatterers in tissue.
Within transducers, there is a FOCUS which concentrates the sound
beam into a smaller beam area than would exist otherwise. This area
of focus is where you will obtain your best images. You will find the
focus on the monitor (arrow), on the vertical millimeter scale. So when
positioning your anatomy make sure it is in the region of the
focus, so that you obtain your best images.
Time Gain Compensation (TGC)
Equalizes differences in received reflection amplitudes because of the reflector depth. Reflectors with equal reflector coefficients will not result in equal amplitude reflections arriving at the transducer if their travel distances are different. TGC allow you to adjust the amplitude to compensate for the path length differences. The longer the path length the higher the amplitude. The TGC is located on the right upper hand corner of the monitor, and is displayed graphically.
B-MODE (brightness mode)
The mode that is used for the display of echoes that return to the transducer. There is a change in spt brightness for each echo that is received by the transducer. The returning echoes are displayed on a television monitor as shades of gray. Typically the brighter gray shades represent echoes with greater intensity levels. This mode allows you to scan.
M-MODE (motion mode)
Is a graphic B-mode pattern that is a single line time display that represents the motion of structures along the ultrasound beam, 1000fps. This mode allows you to trace motion i.e. heart wall motion, vessel wall motion.
PW MODE (pulsed-wave mode)
Frequency change of reflected sound waves as a result of reflection motion relative to the transducer used to detect the velocity and direction of blood flow. This reflection shift can be displayed graphically, as well as audibly. During Doppler operation the reflected
sound has the same frequency as the transmitted sound if the blood is
stationary ( we know that blood is not stationary because it moves) therefore if
the blood is moving away from the transducer a lower frequency is
detected (negative shift) the spectrum appears below the baseline. If
the blood is moving toward the transducer a higher frequency (positive
shift) is detected and the spectral displays above the baseline
Doppler shift
Is dependent on the insonating frequency, the velocity of moving
blood and the angle between the sound beam and direction of the
moving blood. If the sound beam is perpendicular to the direction of
blood flow, there will be no doppler shift therefore there would be no
display of flow in the vessel. The angle of the sound beam should be
less than 60 degrees at ALL times.
Sample Volume
Is the gate length which chooses the doppler shifts that will be used to produce audible sounds or spectral display. The larger the sample volume the more Doppler frequencies detected.
Aliasing
Is the production of false doppler shift and blood velocity information
when the Doppler shift exceeds a threshold. It appears as if the spectral display is cut off and wraps around and reappears in the opposite region of the display.
Spectral Broadening
The widening of the doppler shift spectrum. Meaning the increase of the range of doppler shift frequencies present, owing to a broader range of flow speeds encountered by the sound beam.
Color Doppler
Doppler echoes are usually displayed with gray scale brightness
corresponding to their intensities. In color doppler echoes are
displayed with colors corresponding to the direction of flow that their
positive or negative doppler shifts represent (toward or away from the
transducer). The brightness of the color represents the intensity of the
echoes, and sometimes other colors are added to indicate the extent
of spectral broadening.
Power Doppler
Depicts the amplitude or power of doppler signals rather than the
frequency shift. This allows detection of a larger range of doppler shifts
and therefore better visualization of the smaller vessels, but at the
expense of directional and velocity information.
DOPPLER PRINCIPLES
Doppler
Displays the change in frequency of a wave resulting in the motion of
the wave source or reflector. In ultrasound the reflector is the moving
red blood cell. The Doppler shift is dependent on the insonating
frequency (transducer frequency), the velocity of the moving red blood
cells, and the angle of the sound beam and direction of the moving red
blood cells. The following is the Doppler equation:
Df = (2f v cos q)/c
Df = Doppler shift frequency (difference between
transmitted and received)
f = Transmitted frequency
v = Velocity of the blood
c = Speed of sound
q = Angle of the sound beam and direction of
moving blood cells
The equation can be rearranged to detect the velocity of the blood flow
with the following equation:
v = (Df c)/(2 f cos q)
Two important facts can be observed from this equation. First, since
the cosine of 90 degrees is zero, if the ultrasound beam is
perpendicular to the direction of the blood flow a Doppler shift and
potentially incorrect impression of the blood flow velocities. Second,
the cosine function is steeper above 60 degrees and therefore errors
are magnified with insonating angles above this. Therefore, careful
consideration should be taken to obtain an angle of less than 60
degrees to the direction of the blood flow to obtain reliable and
accurate results in quantifying the velocity in a certain blood vessel.
Power Doppler
Depicts amplitude or power of the Doppler signal rather than the
frequency shift. Therefore, there is less angle dependence and a
visualization of smaller vessels with a Doppler shift, however, with the
sacrifice of velocity and directional information.
Pulsed Wave Doppler
With the use of a sample gate or volume gives a graphical display of all the velocities within the area sampled. The amplitude of the signal is proportional to the number of blood cells and is indicated as a shade of gray.
TERMS FOR LABELING AND SCAN ORIENTATION
- Coronal: The long axis of a scan performed from the
subject’s side where the slice divides the anterior
from the posterior or the dorsal from the ventral in
the long axis
- Transverse: A cross-sectional view
- Sagittal(Longitudinal): The long axis plane
- Superior, Cranial, Cephalad, Rostral: Interchangeable terms indicating the direction towards the head
- Inferior or Caudal: Indicating the direction towards the feet
- Anterior or Ventral: A structure lying towards the front of the subject
- Posterior or Dorsal: A structure ling towards the back of the subject
- Medial: Towards the midline
- Lateral: Away from the midline
- Proximal: Towards the origin
- Distal: Away from the origin
spotted at healthsci.tufts.edu
Sunday, January 10, 2010
Resolution
Obtaining a clear and cystal image is critical in ultrasound, especially when looking for a particular mass in an internal organ. Proper adjustments must be made in order to avoid artifactual echoes from arising so the diagnosis can be accurate and precise. Therefore, the concept of Image Resolution must be appreciated and understood. There are three types of Resolution: Detail, Contrast, and Temporal. Detail Resolution, or Spatial Resolution, can be broken down into Axial and Lateral Resolution. Contrast Resolution refers to Image Brightness (i.e. Output Power, Gain), whereas Temporal Resolution pertains to Time and and the Frame Rate.
Axial Resolution, or LARRD, is the ability of the system to distinguish two structures located at the same direction of the sound beam. LARRD is proportional to half of the Spatial Pulse Length (SPL), and as SPL decreases then LARRD decreases, which is essential to improve image resolution. The dominant factor in determining LARRD is SPL. Another way to reduce SPL is to increase the damping or backing material (make it thicker) or the frequency of the transducer. As more damping or backing material is applied to the thin crystal element, this reduces the number of cycles in a pulse thereby generating a shorter wavelength or SPL. The same applies by changing from a low frequency transducer to high frequency, which can also reduce the wavelength or SPL thus generating a shorter pulse. As previously mentioned, shorter pulses improve image resolution, therefore, in order to decrease LARRD, backing/damping material and the frequency should be increased to improve image resolution.
Lateral resolution, or LATA, is the ability of the system to distinguish two structures located from side to side or perpendicular to the beam. LATA is equal to the beamwidth in the scan plane. As with LARRD, LATA is improved as it decreases, however, the image can only be improved through "focusing". Focusing can be done by applying lens outside of the cystal within the transducer (external), using a curved cystal element (internal), or electronic focusing through Phasing or Time-Delay. Electronic focus is the ability of the transducer to focus the beam by "steering" the sound through phasing. In addition to time delay, greater curvature in the phase delay pattern will have greater time delays thus moving the focus closer to the transducer. On the other hand, less curvature will generate shorter time delays thus moving the focus deeper. Therefore, phasing and time delay provides electronic control of the location of the focus.
Focusing improves LATA, but in Contrast Resolution, the image is improved by a change in the following parameters: output power, gain, time gain compensation (TGC), post-processing, and log compression (log Comp). Contrast resolution refers to image brightness, and if the image is too bright, then one or more of the following parameters are used to change the contrast of the image. For example, by changing the log comp (dB), the number of bits are increased thereby producing a dark image. Contrast resolution are broken down into two types: high contrast and low contrast. In high contrast, a bright image is produced, speckle, increased frame rate, low persistance, and narrow dynamic range. As a result, a bad resolution is obtained. High contrast are often generated for echo studies, however, Low contrast is of the opposite. In Low contrast, a dark image is produced, less speckles, slower frame rate, high persistance, and wide dynamic range. As a result, good resolution is obtained. An example of using Low Contrast resolution is during an abdominal scan.
During Low Contrast Resolution, frame rate is reduced thus degrading Temporal Resolution. Temporal Resolution is the ability of a display to distinguish closely spaced events in time and to present rapidly moving structres correctly. Therefore, Temporal Resolution improves as Frame Rate (FR) increases, and this can be seen by High Contrast Resolution. Temporal Resolution is expressed in milliseconds, and describes the time required to generate one complete frame. Each frame is made of many scan lines, and as the Lines Per Frame (LPF) increases, then FR decreases thus degrading Temporal Resolution. On the other hand, as LPF decreases, then FR increases thus obtaining improved Temporal Resolution.
FR is equal to PRF but inversely proportional to "n" multiplied by LPF. As more scan lines are present, FR is decreased due to the increased time for the reflected echo to come back to the sound source. However, another factor can affect FR, and this is the size of the sector beam. That is, as sector size decrease, then the scan lines on each frame are reduced thereby increasing FR. As a result, Temporal Resolution is improved. Also, by adding more focal points (multifocus), FR decreases thus Temporal Resolution gets degraded, but by reducing focal points, Temporal Resolution increases but LATA gets degraded.
Sunday, January 3, 2010
Perpendicular Incidence vs. Oblique Incidence
Perpendicular Incidence occurs when soundwave hits a surface or tissue boundary that is perpendicular to the media. The variables involved in perpendicular incidence consists of the incident pulse, reflected pulse, and transmitted pulse. The incident pulse is the sound sent out from the transducer and hits the first media at a 90 degree angle at 100%. Once the incident pulse hits the surface, and depending upon the impedance of the first medium, an echo is "reflected" back to the sound source and this is called the reflected pulse. If, however, the impedance on the first medium is less, then a pulse echo is transmitted through the first medium into the second thereby inducing a transmitted pulse. The reflected pulse is the only sound that changes direction opposite to the incident pulse, whereas the transmitted pulse is unchanged and remains in the same direction as that of the incident pulse.
Impedance is the resistance of the medium, and is equal to the density(p) multiplied by the propagation speed. Impedance units are in rayls, and the greater the acoustic impedance, the more dense the material (i.e. bone, air). Therefore, if the medium is more resistant (more incompressible), then density and propagation speed increases. This will cause more echoes to reflect back to the sound source thus an image will be produced (mostly shadowing or attenuation). On the other hand, if resistance or impedance decreases, then more transmitted pulses are generated and no image will be produced (i.e. CW).
Impedance can be broken down into two types: Intensity Reflection Coefficient (IRC) and Intensity Transmission Coefficient (ITC). IRC is the fraction or percentage of the reflected intensity going back through the first medium, and is determined by dividing the relected echo and incident pulse. ITC, on the other hand, is the fraction or percentage of transmitted intensity going through the first medium and into the second, and is determined by dividing the transmitted echo and incident pulse. Both IRC and ITC depend upon the impedances of media one and media two (Z1 & Z2). If there is a large difference between the two media, a stronger echo is produced and IRC increases. If the two media are almost alike, a weaker echo is produced and ITC increases. If however, both mediums are equal, then no echo is produced thus no reflection and ITC is equal to the incident intensity.
If sound hits the media at an oblique angle, then Oblique Incidence occurs. In Oblique Incidence, echoes may reflect back to the sound source or may transmit or "refract" through the medium. Oblique Incidence is defined as the change or shift in the direction of sound due to differences of propagation speeds. As previously mentioned, Perpendicular Incidence depend upon the resistance or impedance of the medium, whereas in Oblique Incidene, the variables invovled depend upon the propagation speeds on either side of the boundary. Oblique Incidence consists of the incident angle, reflected angle, and transmitted angle. The incident angle is "always" proportional to the reflected angle. The transmitted angle plays a role in refraction and depends upon the difference between the propagation speed of medium one and medium two.
Refraction is the change of direction in sound when crossing a boundary. It is caused by Oblique Incidence and a difference in propagation speeds on either side of the boundary. That is, if the propagation speed in medium two is greater, then the transmitted angle increases thus making it greater than the incident angle (and vice-versa). If, however, both of the propagation speeds are equal, then the transmitted angle will be proportional to the incident angle. The relationship between the incident and transmitted angle can be expressed in Snell's Law
Attenuation
Keywords:
Amplitude
Intensity
Penetration
Incident Pulse
Refraction
Reflection
Scattering
Absorption
Inhomogenous/Heterogenous
Half Power Distance
Noise
Shadowing
Anechoic
Output Power
TGC
Attenuation is the reduction of amplitude and intensity as sound propagates or penetrates farther down into the medium. Amplitude is definded as the maximal cyclical change in a quantiy such as pressure (Mpa), whereas intensity is defined as the rate at which energy passess through a unit area (power over area). Both are indicators of strength of sound and are affected as penetration decrease.
Attenuation is caused by a number of factors: refraction, reflection, scattering, and absorption. Refraction is the change or shift in the direction of sound transmitted from the incident pulse after going through the tissue surface at an angle that may or may not be equal to the incident pulse angle (i.e. Oblique Incidence). Reflection is the reflected echo coming back to the sound source (i.e. transducer)from the tissue surface going in opposite direction to the incident pulse that may be perpendicular or oblique. Scattering is when sound hits an inhomogenous or heterogenous tissue surface and more reflected echoes are sent back to the sound source thus displaying a suboptimal image.
Sound scatter occurs with increasing frequences thus attenuation increases because penetration (depth of images) decreases. Frequency is inversely proportional to penetration, and as penetration decrease, amplitude and intensity become reduced. Therefore, lower frequencies are used for deeper penetration in which attenuation is decreased, whereas higher frequencies are used for structures located superficially requiring no deeper penetration. If, for example, a 5MHz frequency transducer is used on an overweight patient for an abdominal scan, sound scatter would increase thus the image displayed would be highly attenuated. The only way to fix this problem is to select a low frequency transducer, adjust output power, or TGC in order to decrease attenation and improve image resolution.
Absorption is the dominant factor contributing to attenuation of ultrasound in soft tissues, and is defined as the conversion of sound to heat. That is, absorption occurs when the tissue absorbs the sound and converts the echo to heat. As a result, the transferred energy (or heat) becomes lost and does not come back to the sound source thus a suboptimal image is displayed. The rest of the other factors contribute little to attenuation in most cases. The units for attenuation are in decibels (db), and is proportional to half of the frequency multiplied by the path length or wavelength. Therefore, as frequency and the path length or wavelength increases, attenuation increases.
Attenuation is higher in air (i.e. lung) and in bone than in other soft tissues (half power distance = 1-5cm) with a half power distance of 0.08 and 0.7cm, respectively. Attenuation occurs least in liquid or water due to a half power distance of 380cm. The half power distance refers to the distance that sound will travel to a particular tissue before its energy or amplitude is attenuated to half of its original value. Therefore, the presence of air and bone can interfere the ultrasound image by displaying increased noise or shadowing. In the presence of liquid or water, the image displayed in the monitor is anechoic.
In order to avoid attenuation, it is important for the tech to know the factors contributing to attenuation. The half power distances should also be noted and when scanning, the tech should avoid the presence of air or bone, which could interfere ultrasound image. Attenuation could also be avoided by adjusting the frequencies, output power, or TGC, which can be found on or near the machines to improve image resolution.
Subscribe to:
Posts (Atom)